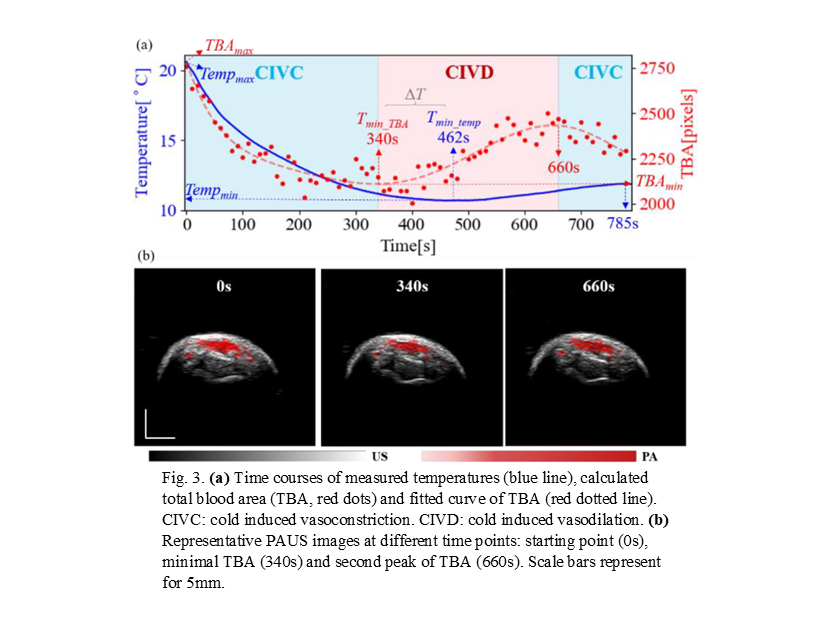
Fig. 3. (a) Time courses of measured temperatures (blue line), calculated total blood area (TBA, red dots) and fitted curve of TBA (red dotted line). CIVC: cold induced vasoconstruction. CIVD: cold induced vasodilation. (b) Representative Photoacoustic Ultrasound images at different time points: starting point (0s), minimal TBA (340s) and second peak of TBA (660s). Scale bar represents for 5mm.